Grow
See your sales, customers and traffic in numbers
A daily summary and live visitors on the home page, 34 ready reports in the report library, and a conversion funnel and traffic sources on the traffic screen. Every report exports as CSV.
The numbers you need to decide
Daily summary
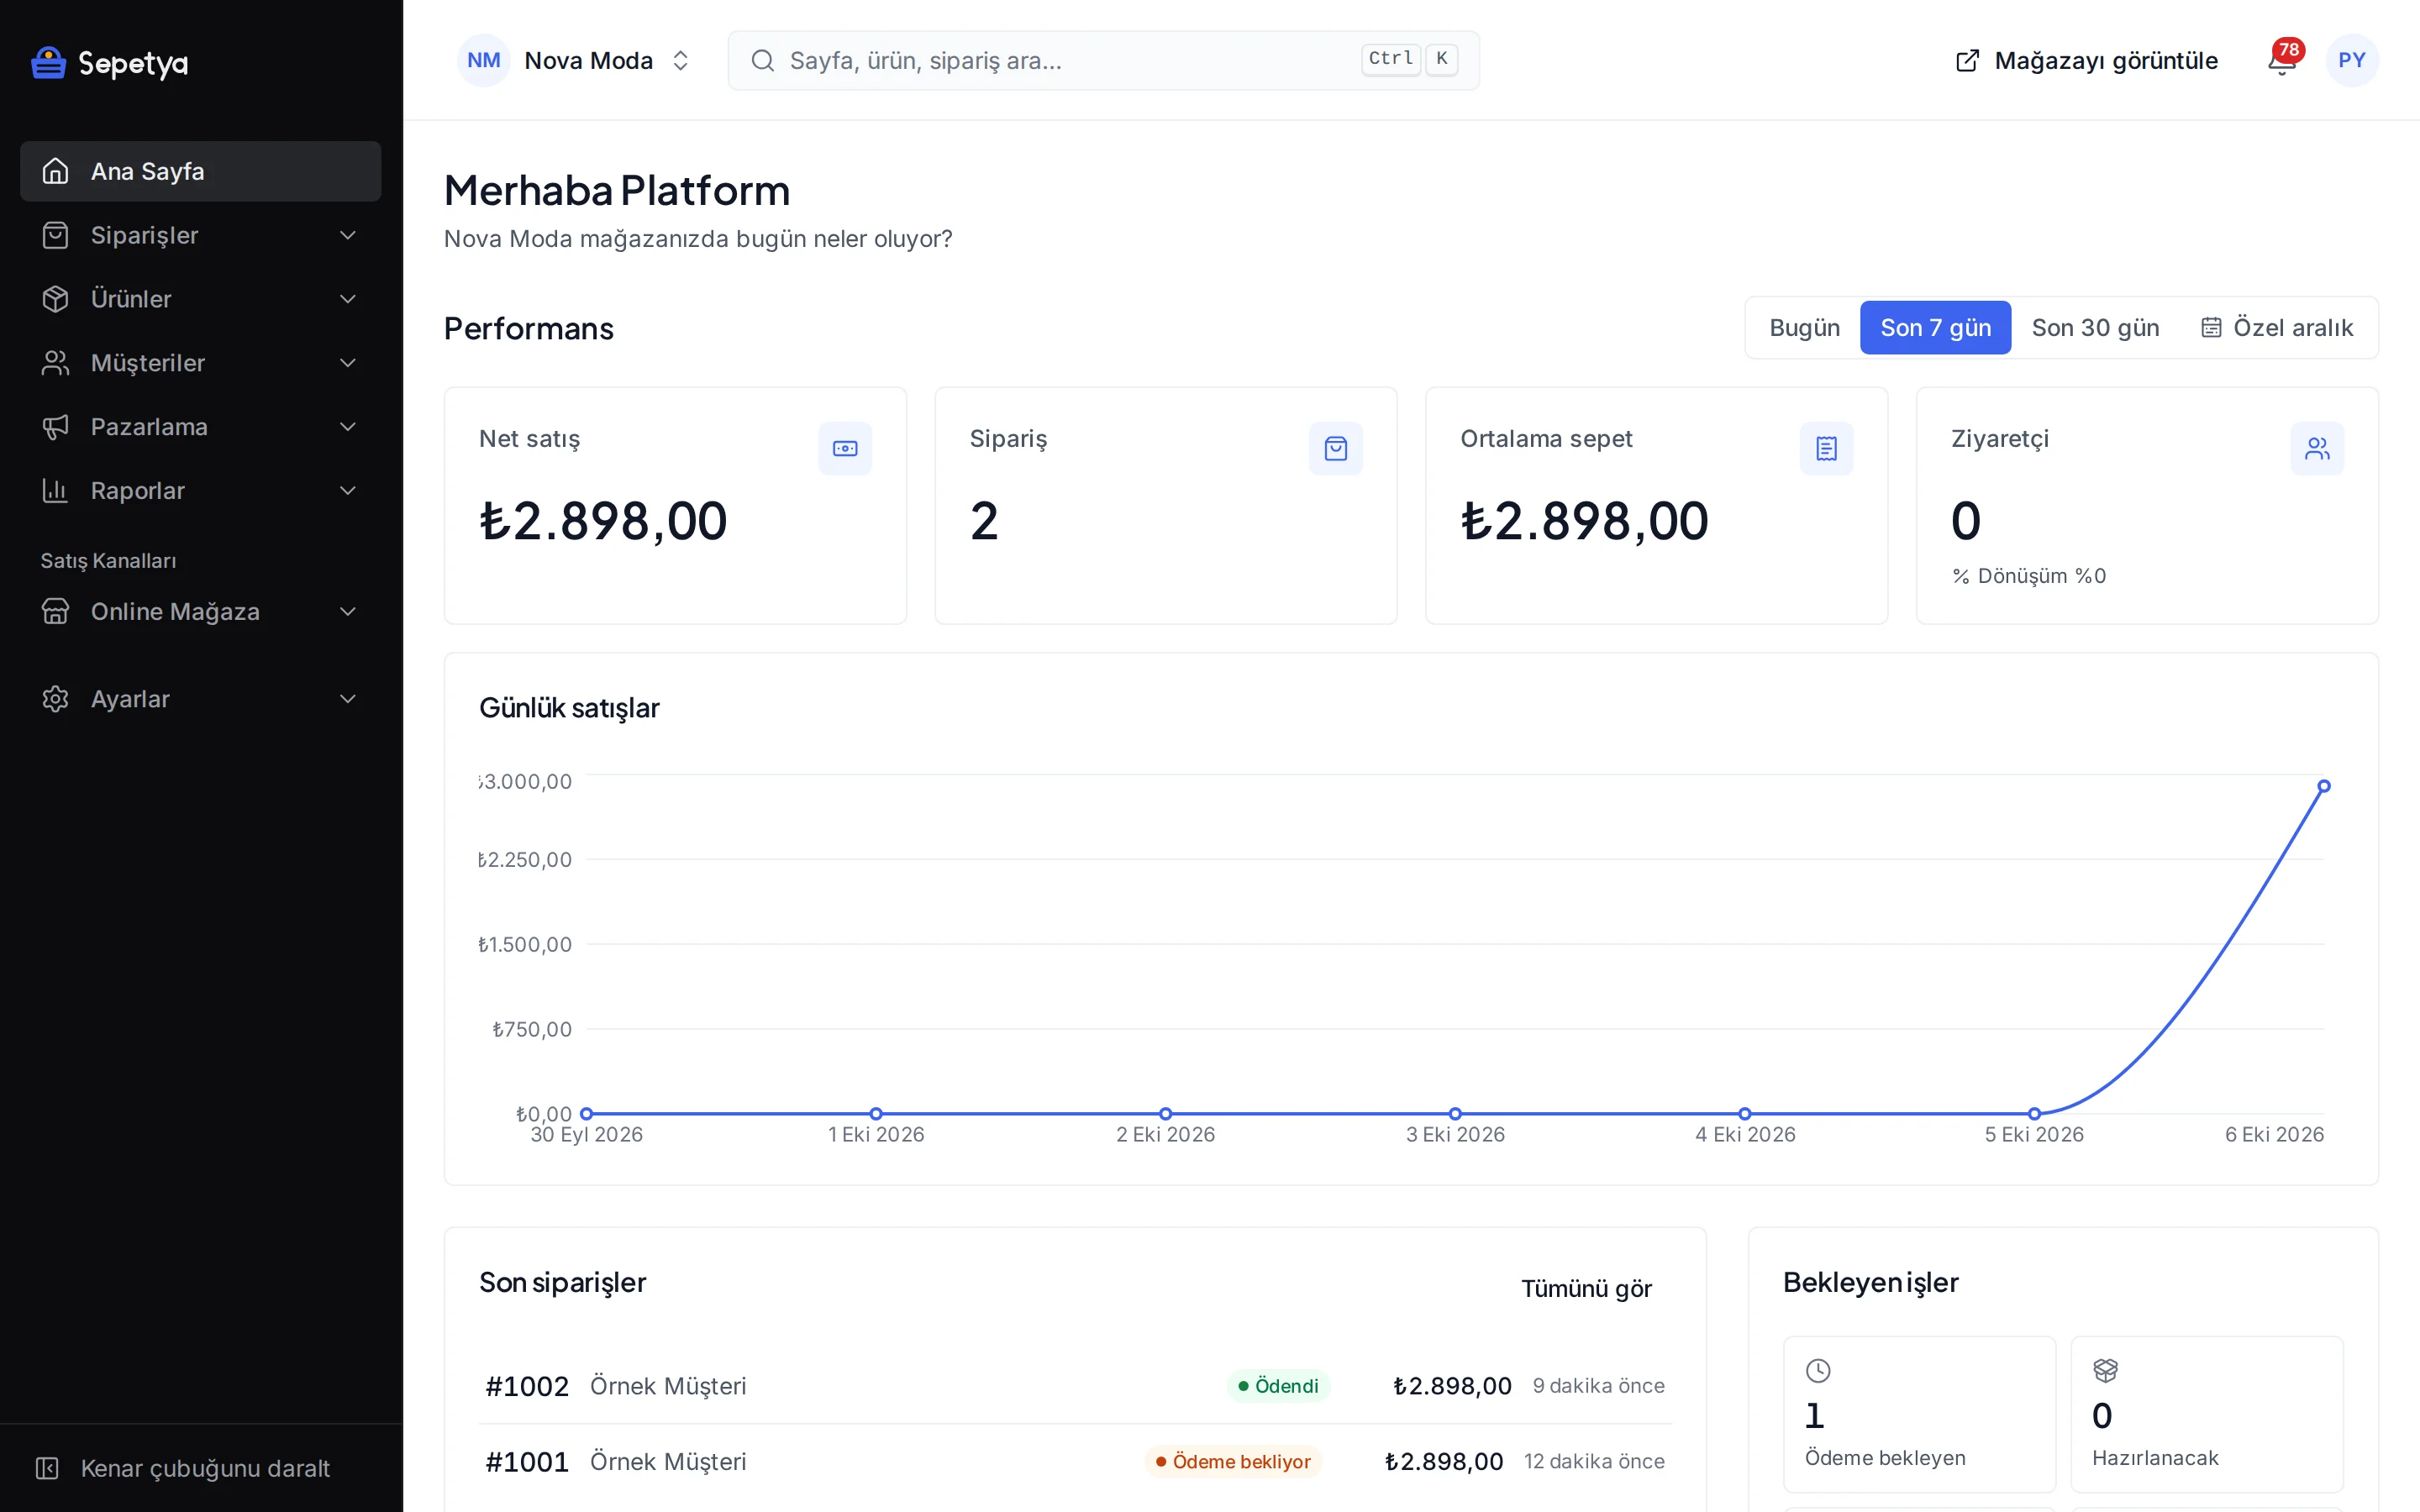
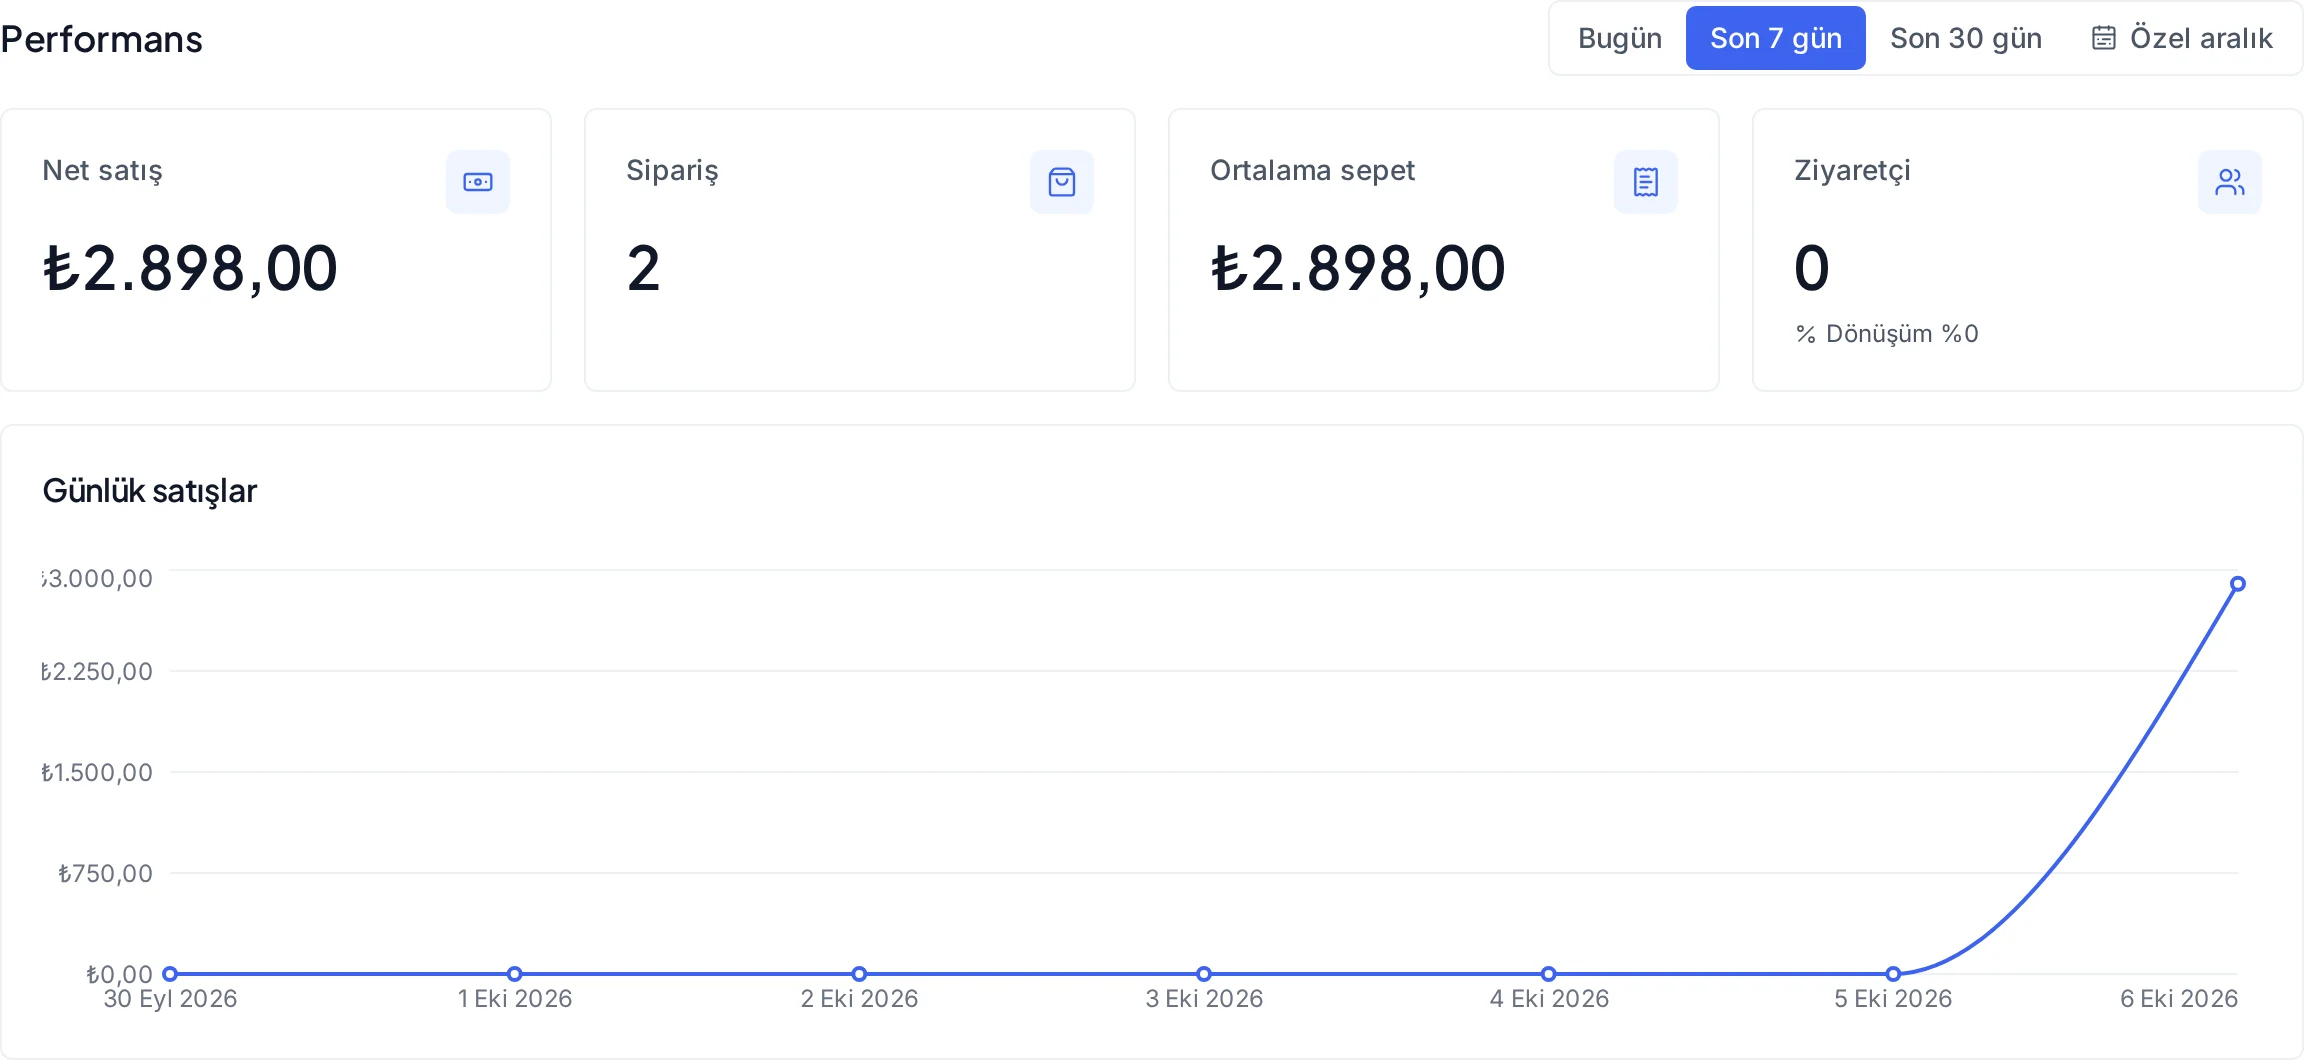
The home page shows the sales summary for today, the last 7 and 30 days (or a date range you pick), plus pending work, latest orders and low stock.
Live visitors
The number of visitors in the last five minutes refreshes automatically.
Report library
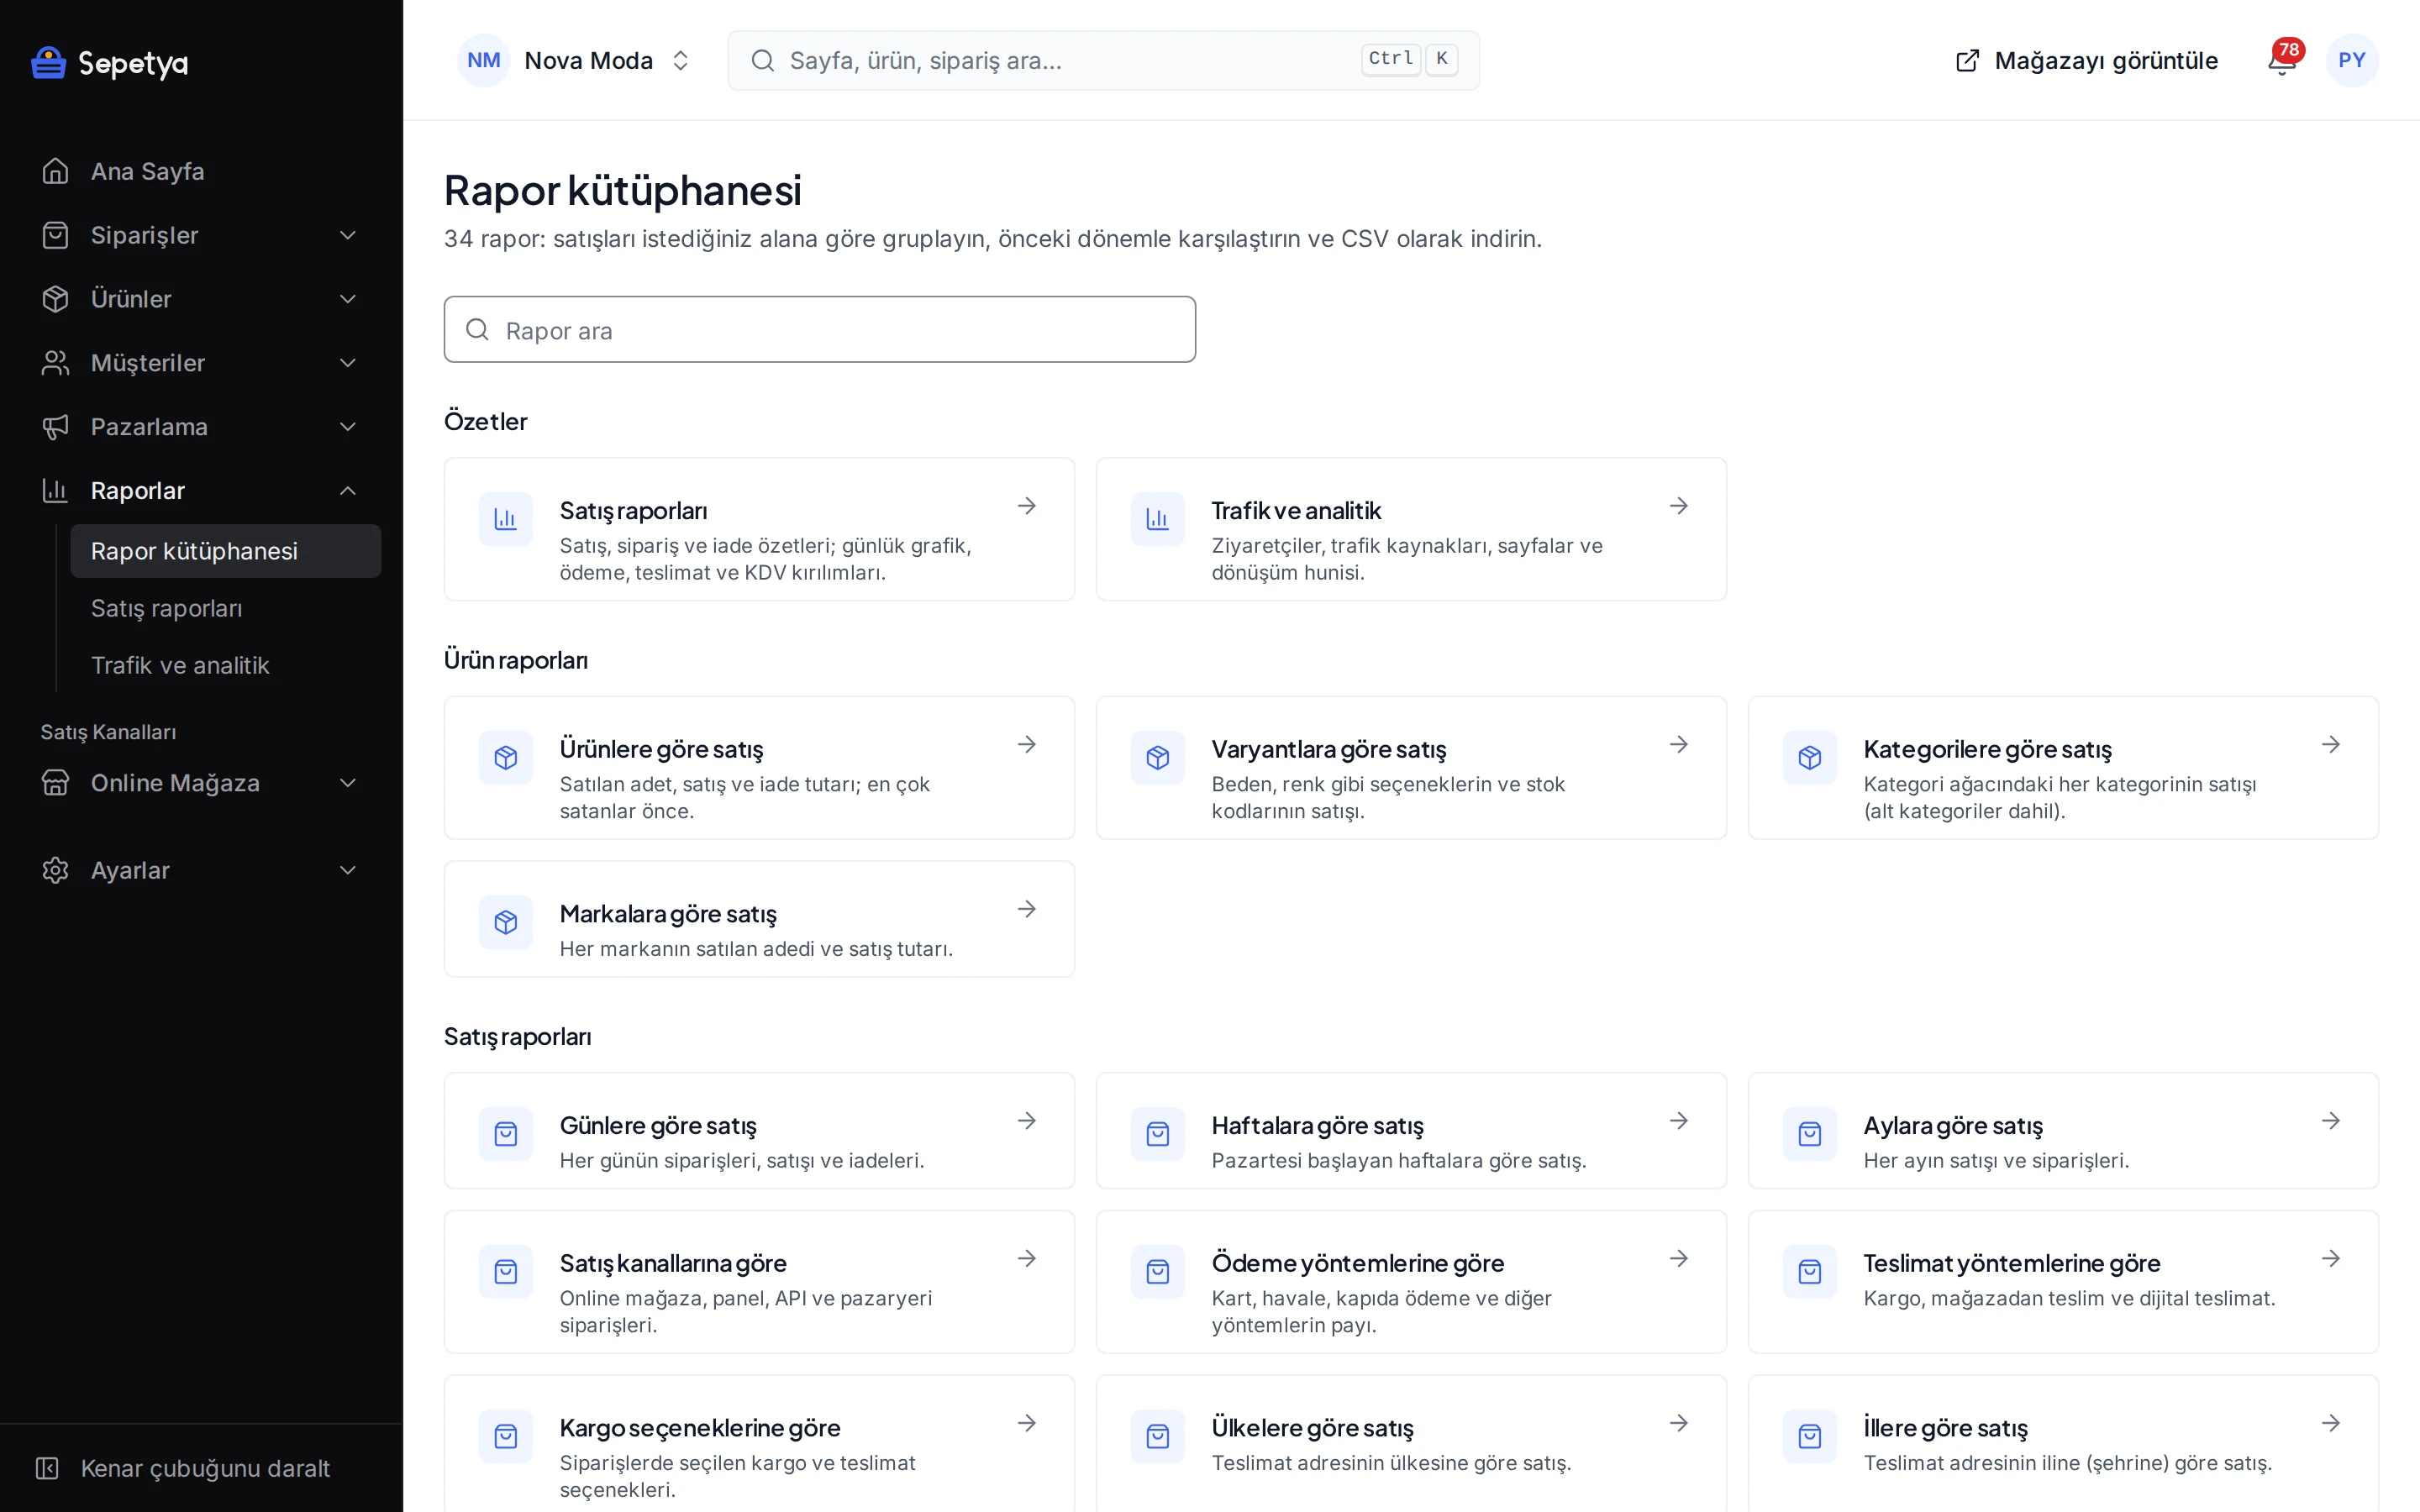
Thirty-four ready reports in six sections: products, sales, customers, marketing, returns and stock value. Pick a date range and compare with the previous period.
Conversion funnel
See how many visitors move through visit, product view, add to cart, checkout start and purchase.
Traffic sources
Direct, search, social, e-mail, ads and referring sites, plus UTM data, landing pages and device breakdowns.
CSV export
Download any report as CSV with all its groups and rows and use it in your accounting or spreadsheet software.
Report library and traffic
One explorer, thirty-four reports
The report library offers 34 ready reports in six sections: sales by product, variant, category and brand; sales by day, week and month, channel, payment and delivery method, country, province, coupon and currency; new and returning customers and top spenders; traffic source, UTM, landing page and device; returns; and stock value. Every report opens in the same explorer: pick a date range, compare with the previous period of the same length, page through all groups and download as CSV.
The traffic and analytics screen follows visitors through the conversion funnel. You see traffic source (direct, organic search, paid search, social, e-mail, referring site …), device, browser, operating system and country breakdowns.
- Sales are grouped by 23 different fields and all groups of the chosen field go into the CSV
- The stock value report shows cost and sales value and also reports how many variants have no cost entered
- Return reports by day, reason, product, order, payment method and channel
- Reports and CSV files are filtered by the staff member’s permissions and sales channel restriction
The privacy side of measurement
Cookie-free built-in analytics and optional deeper measurement
The built-in analytics sets no cookie: visitors are counted with a pseudonymous identifier that changes every day, cannot be reversed and does not follow visitors across days; bots are not counted. The source of an order (UTM, referring site) is recorded only for visitors who gave analytics cookie consent; the order of a visitor who did not appears as “direct”.
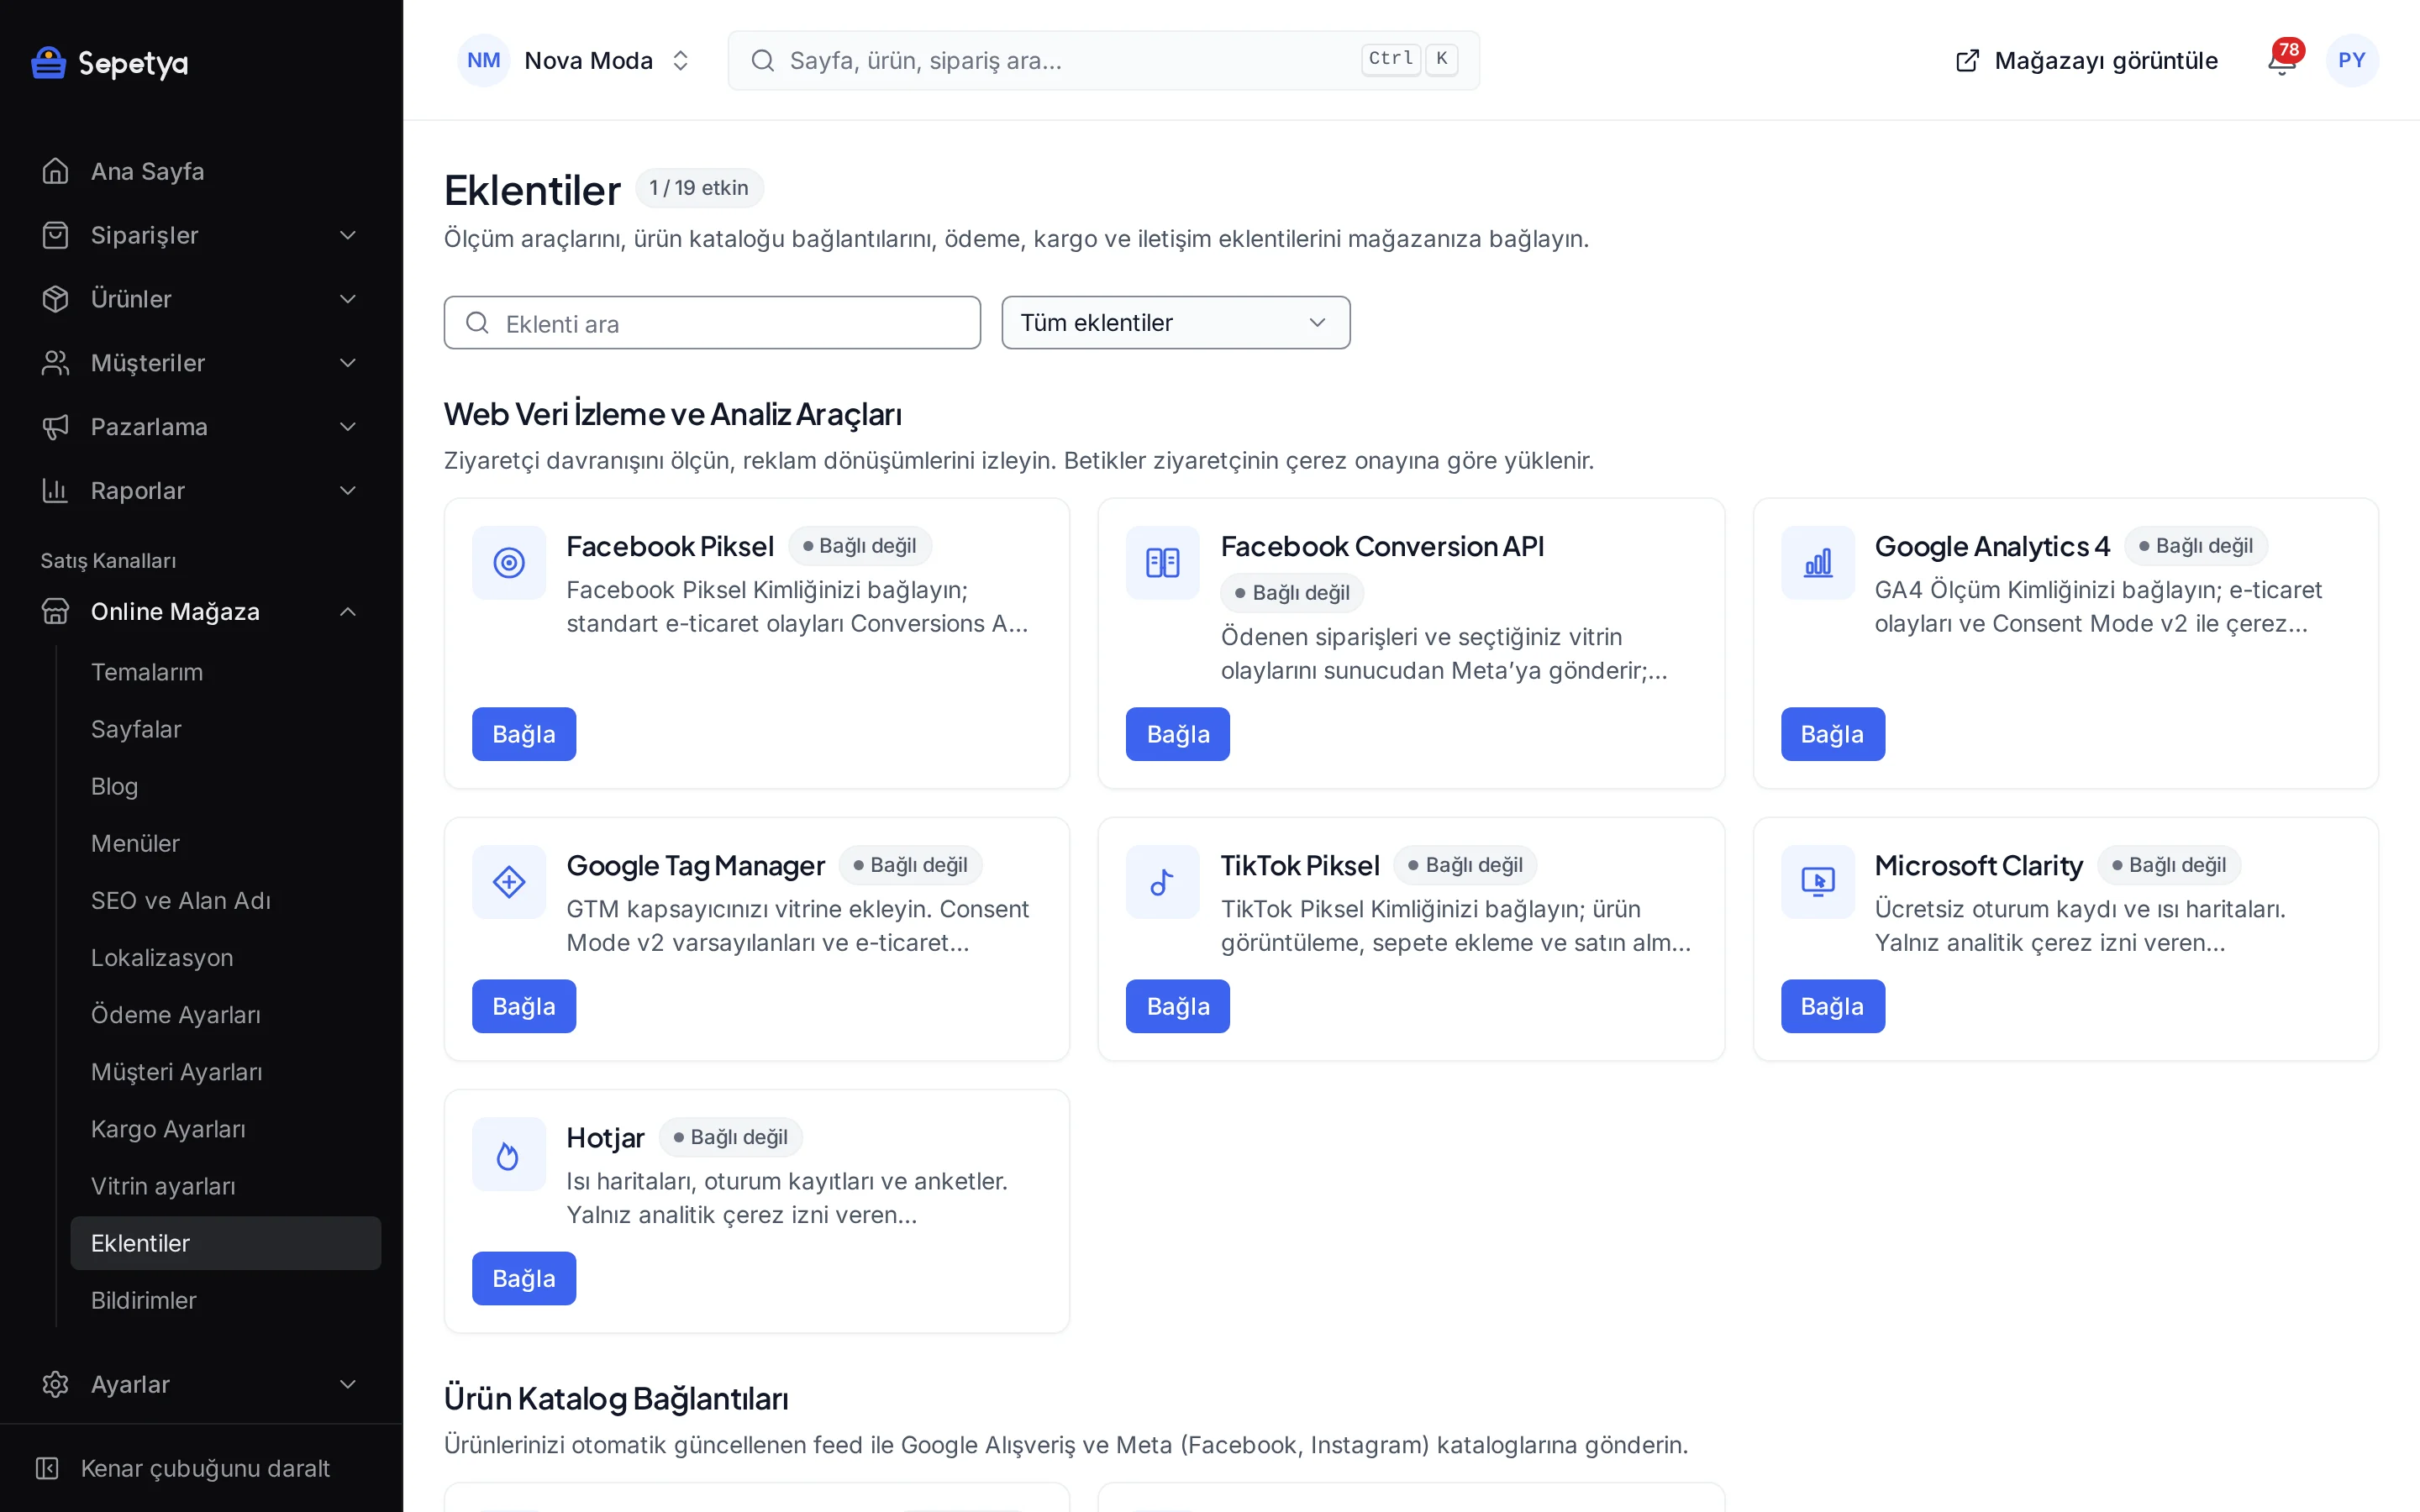
For deeper measurement you can add the Google Analytics 4 and Tag Manager apps, and the Microsoft Clarity and Hotjar apps for heat maps, all tied to the cookie consent model.
- Visitor counts and events are kept as daily totals; there is no per-visitor session recording
- GA4, GTM, Clarity and Hotjar load only when the matching cookie consent is given
- Product page and checkout events are sent in the GA4 e-commerce format
How it works in the dashboard
- Step 1: 1
Start with the home page
Look at today’s summary, pending work and low stock on the home page and change the date range.
- Step 2: 2
Open a report
Pick a report under Reports › Report library and set the date range and the comparison with the previous period.
- Step 3: 3
Study the traffic
See the conversion funnel and traffic sources under Reports › Traffic and analytics.
- Step 4: 4
Download the CSV
Download the report as CSV and use it in your accounting or spreadsheet software.
Frequently asked questions
Which reports can I get?
Thirty-four reports in six sections: products, sales, customers, marketing, returns and stock value. You can group sales by 23 different fields, compare with the previous period and download as CSV.
Who can access the reports?
Reports appear according to the staff member’s permissions: reports with customer, order and stock data also need the matching permission, and reports of staff with a sales channel restriction are filtered to that channel. Find permissions under security and team permissions.
Can I see the number of live visitors?
Yes. The home page shows the number of visitors in the last five minutes and refreshes it automatically.
Does the built-in analytics use cookies?
No. Visitors are counted with a pseudonymous identifier that changes every day; there is no tracking across days and no session recording. The source of an order is recorded only for visitors who gave analytics cookie consent. Assess with your legal adviser whether this design is enough for your business.
Can I use Google Analytics?
Yes. The GA4 and Tag Manager apps are ready and work according to cookie consent with Consent Mode v2. See ads and product feeds for details.
Is there session recording or attribution modelling?
There is no built-in session recording or multi-touch attribution; an order is labelled with the visitor’s first touch source. For heat maps and session recordings you can use the Microsoft Clarity or Hotjar apps.
Start seeing your numbers today
During the trial set up your store; the home page and reports start filling up with your first orders.